July 14, 2026
Mapping Certified Durable Carbon Removal in the United States
As of June 20, 2026, 40 U.S. projects have received carbon removal credit issuances through Puro.earth and Isometric, representing approximately 850,000 tonnes of net CO₂e removals. While this represents only one segment of the broader carbon removal ecosystem, certified projects provide the clearest picture of technologies that have progressed beyond development into operations with independently verified delivery.
Key Findings:
- Certified carbon removal has grown rapidly in the United States since 2022.
- Projects are emerging across multiple regions rather than concentrating in a few innovation hubs.
- Biochar Carbon Removal currently dominates certified deployment, although additional pathways are emerging.
- Feedstock availability, existing industrial ecosystems, and suitable deployment environments largely dictate where projects are built.
- Most certified projects are located in smaller communities rather than urban centres.
Scope of Analysis
Carbon dioxide removal (CDR) is rapidly evolving from pilot projects into commercial deployment. However, much of the public discussion focuses on announced facilities, funding rounds, or future contracts. Less attention has been paid to where durable carbon removal has actually been delivered and independently verified.
This analysis examines 40 U.S. durable carbon removal projects that have received issued carbon removal credits through Puro.earth or Isometric as of June 20, 2026 to provide a snapshot of where certified durable carbon removal is already taking place in the U.S.
The analysis excludes projects that are under construction, operating but not yet certified, pilot or demonstration facilities without issued credits, and projects pursuing non-crediting business models. Certification therefore serves as a benchmark for comparing projects that have evolved into verified delivery.
Certified Durable Carbon Removal Is Growing
Key takeaway - The number of certified projects and issued carbon removal credits has increased rapidly.
As of June 20, 2026, 40 durable carbon removal projects operating in the United States have been issued carbon removal credits through carbon removal registries Puro.earth and Isometric. Together, these projects have been issued credits representing 850,000 net tonnes of CO₂e removals between 2022 and the first half of 2026.
The number of projects receiving their first or additional credit issuances continued to rise, reaching 24 projects in 2025, with 18 projects already recording issuances during the first half of 2026.
Growth has accelerated significantly over the past couple of years. Annual issued credits increased from 29,000 tonnes in 2023 to 460,000 tonnes in 2025, representing a compound annual growth rate (CAGR) of approximately 298% over the two-year period.
While durable carbon removal remains a nascent industry, these trends indicate that project developers are increasingly progressing beyond project announcements and commissioning into verified removals. Certification represents an important milestone, providing independent evidence that carbon removals have been generated in accordance with established methodologies and verification requirements.
Certified Projects Are Emerging Across the United States
Key takeaway - Certified projects are distributed across multiple regional clusters rather than concentrated in a few states.
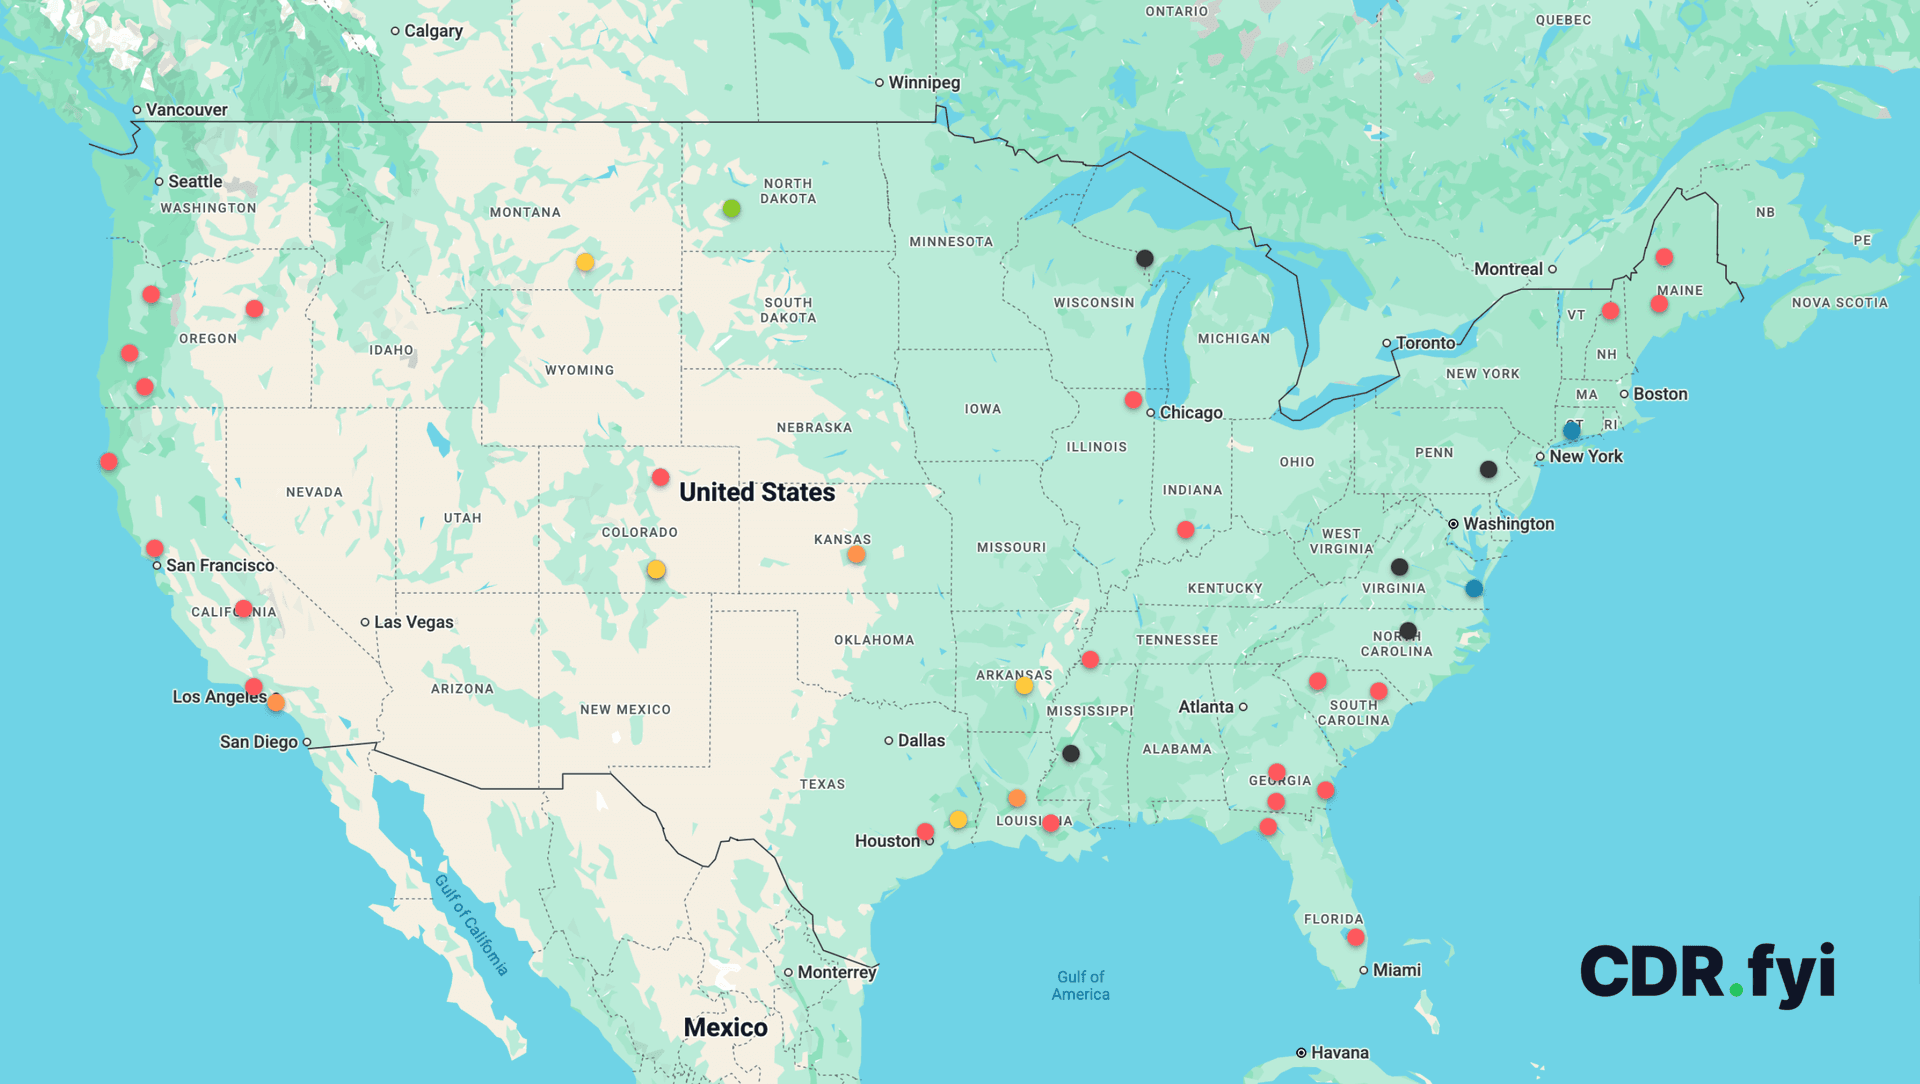
The 40 certified projects included in this analysis are located across 22 states, illustrating that durable carbon removal is emerging as a national industry rather than one confined to a few geographic hotspots. California currently hosts the largest number of certified projects (five), followed by Oregon (four), while Colorado and Georgia each host three, and 18 other states account for 25 projects.
Looking beyond individual states, regional patterns become more apparent. The South hosts the largest share of certified projects, accounting for 17 projects (42.5%), followed by the West with 13 projects (32.5%). The Midwest and Northeast each host five certified projects.
Although projects span much of the country, they are not evenly distributed. Instead, several regional clusters have emerged where natural resources, industrial activity, and suitable deployment conditions coincide. These clusters suggest that durable carbon removal in the U.S. has developed in response to regional comparative advantages.
As additional projects progress toward certification, these geographic clusters are likely to expand as the CDR industry expands to new geographies.
Map of Durable Carbon Removal Projects in the US
Location of CDR projects that have issued carbon removal credits
(Click here to access the interactive map)
Which Technologies Are Leading?
Key takeaway - Biochar Carbon Removal currently dominates certified deployment, while other durable carbon removal pathways are beginning to scale.
The U.S. carbon removal landscape is currently led by Biochar Carbon Removal, which accounts for 24 of the 40 certified projects. This reflects the relative maturity of biochar technologies, established methodologies and practices, and the widespread availability of biomass feedstocks across the United States.
Other durable carbon removal pathways are also emerging. Enhanced Weathering has experienced notable growth since receiving its first credit issuances in 2025, while Biomass Carbon Removal and Storage (BiCRS), Biomass Storage, BECCS, and Wastewater Alkalinity Enhancement contribute additional diversity to the certified project portfolio.
Each pathway relies on different feedstocks, industrial processes, and deployment environments. Together, they demonstrate that durable carbon removal is not a single technology but rather a portfolio of approaches designed to achieve the same outcome: long-term removal and storage of atmospheric carbon dioxide, while providing other environmental and economic benefits.
Although biochar currently dominates in terms of project count, continued technological development, project buildouts, certification methodologies, and commercial demand are expected to further diversify the market over time.
Commercial-Scale Delivery Is Beginning to Emerge
Key takeaway - Most certified projects remain relatively small, with a growing number having reached early commercial scale.
Today's certified project landscape remains dominated by small and medium-sized facilities. Of the 40 certified projects, 33 have averaged annual credit issuances below 5,000 tonnes, while only seven projects have exceeded 5,000 tonnes per year. Only one project currently exceeds 25,000 tonnes annually.
This distribution reflects the current stage of development in the CDR industry where developers focus on demonstrating reliable operations, improving economics, and establishing market demand for both the services and carbon credits, before pursuing significantly larger deployments.
The current landscape suggests an industry that has expanded through many distributed projects, rather than relying on a small number of very large facilities. Continued investment, technology learning, industry partnership, and growing demand for durable carbon removal credits will likely determine how quickly projects scale over the coming years.
Carbon Removal Is Built on America's Industrial Base
Key takeaway - Feedstock availability, existing industrial ecosystems, and suitable deployment environments largely explain where certified carbon removal projects are being built.
Certified carbon removal projects are rarely standalone facilities. Instead, they build upon existing forestry, agriculture, mining, waste management, and manufacturing industries by creating new value from existing resources and infrastructure.
Unlike many industries that are located close to customers or major population centres, durable carbon removal projects are typically located close to the resources and infrastructure required to operate.
The current certified project landscape demonstrates that Forestry & Wood Residues are the dominant feedstock category, followed by Agricultural Residues and Mineral Feedstocks. These resources underpin the majority of certified projects currently operating in the United States.
These feedstocks are closely linked to existing industries. Forestry operations, sawmills, lumber mills, and pulp and paper facilities provide woody biomass residues that can be converted into biochar or stored for the long term. Agricultural industries also generate rice husks, nut shells, sugarcane bagasse, poultry litter, and other agricultural residues suitable for biomass-based carbon removal pathways. Mining operations supply basalt and other silicate minerals used for Enhanced Weathering, while wastewater treatment facilities and municipal waste streams support several emerging approaches.
As a result, these carbon removal projects have become part of existing industrial value chains, creating additional value from materials that might otherwise be underutilized while leveraging existing infrastructure, expertise, and logistics.
While policy differences also influence project geographies, differences in industrial resources have largely determined the regional distribution of projects, as well as suitable deployment environments. Regions with abundant forestry resources, agricultural residues, or mineral deposits, and vast agricultural land naturally provide favourable conditions in forms of feedstocks and deployment sites for specific carbon removal pathways.
Carbon Removal Is Creating Opportunities Beyond Climate
Key takeaway - Most certified projects are located in smaller communities rather than urban centers.
Based on the U.S. Census Bureau's 2020 Urban Area classification, 28 of the 40 certified projects (70%) are located outside Census-designated Urban Areas and are therefore classified as rural. Nearly half of all projects are also located in counties with populations below 100,000.
This pattern is closely linked to the industrial ecosystems described in the previous section. Forestry operations, agriculture, mining, and biomass processing facilities are typically located outside major metropolitan areas, and carbon removal projects naturally develop alongside these industries rather than near centres of large businesses with demand for carbon credits.
For many communities, durable carbon removal represents an opportunity to diversify existing industries. Projects can create additional value from forestry residues, agricultural by-products, municipal organic waste, and mineral resources while supporting local investment and employment, and potentially help address local issues related to waste disposal, water, land and forest management, and wildfire prevention for example.
Although today's certified projects remain relatively modest in scale, their geographic distribution suggests that durable carbon removal could contribute to rural economic development by strengthening existing industrial supply chains and creating new markets for regionally available resources.
---
Notes on Data
Data Sources: All of the data used in preparing this report is based on projects and credit issuances publicly listed on carbon removal registries, primarily Puro.earth and Isometric. To provide feedback on the CDR.fyi data model, reach out to us at partners@CDR.fyi.
Project Location: Locations of projects are based primarily on geo-coordinates provided by project developers in their respective Project Design Documents (PDDs). For projects with multiple deployment locations, mainly enhanced weathering projects which span across vast areas and wastewater alkalinity enhancement projects which operate out of multiple wastewater treatment plants, locations are tied only to a location that was determined to be most representative for each project. For projects without publicly disclosed geo-coordinates or addresses, the locations are estimated based on further research of publicly available reports, such as news articles, company announcements, and other secondary sources.
CDR.fyi tracks carbon removal purchases & deliveries with a permanence of hundreds to thousands of years. For any corrections or questions, contact team@CDR.fyi. For data licensing & partnership inquiries, contact partners@CDR.fyi.Join over 1,000 companies and sign up for free access to the CDR.fyi Portal to gain market insights, showcase your company’s profile and progress, and get on the CDR Map!
Acknowledgements
Thank you for exploring Mapping Certified Durable Carbon Removal in the United States.
Data, analysis, and content for this report were prepared by Tank Chen and the CDR.fyi team.
---
Recommended Readings
If you are interested in learning more about integration of carbon removal activities in industries, the following content are highly recommended:
- Integrating Carbon Dioxide Removal with Industrial Processes: Challenges and Policy Opportunities - Bipartisan Policy Center
- A roadmap for catalyzing the market for carbon removal - Carbon Removal Alliance
- What do we mean when we say we need to “integrate CDR into industry”? - Carbon Removal Standards Initiative (CRSI)
- The potential role of state and local governments to drive the scale-up of carbon dioxide removal - Institute for Responsible Carbon Removal
- Is heavy industry the future of carbon removal in the US? - Latitude Media
- Seizing the Industrial Carbon Removal Opportunity - RMI