February 07, 2024
Durable CDR Market 2023: Year in Review & Key Trends
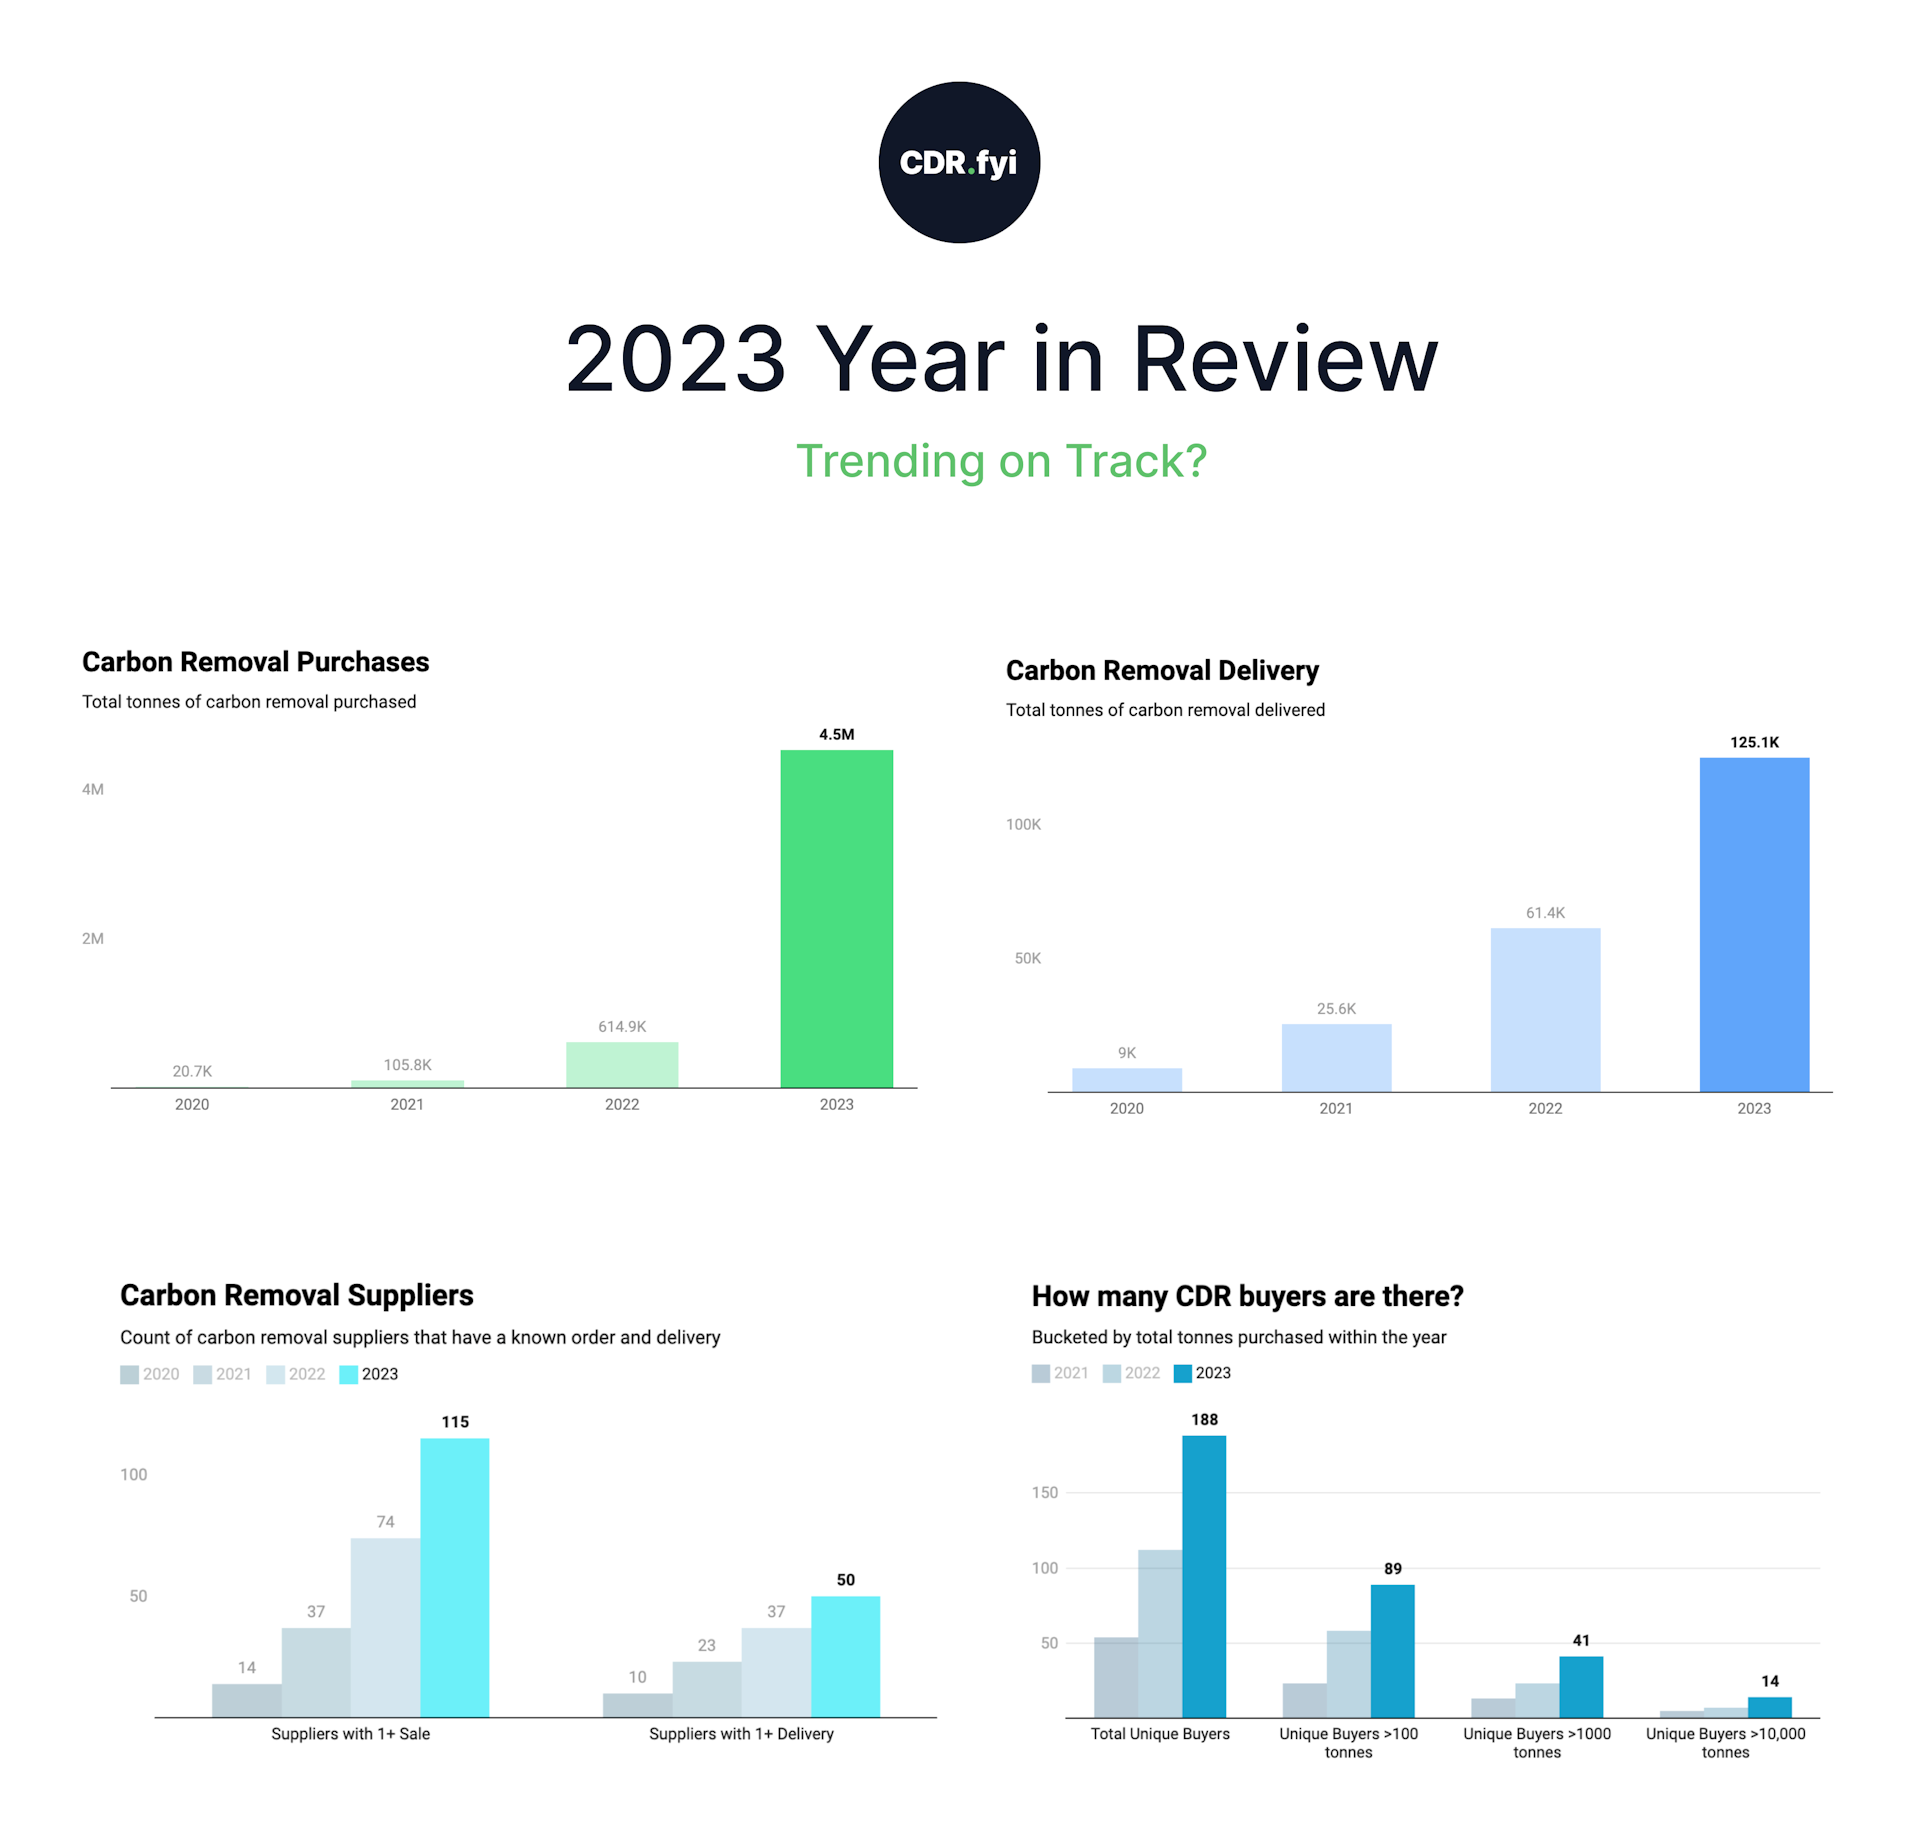
Since 2021, durable carbon dioxide removal (CDR) has rocketed from only a handful of suppliers and 0.009 Mt tonnes delivered in 2020, to hundreds of companies testing out dozens of removal methods in the real world, delivering over 0.1Mt and selling 4.5Mt in 2023. It is, to say the least, a growth story.
These carbon removal suppliers are fueled by hundreds of buyers and tens of investors. CDR purchase volume has increased more than 5x every year since 2020. If the current growth trend holds, we will reach the necessary mid-century volumes. Ignition sequence finalized, engines started.
But it’s too early to celebrate. Without a near-term influx of new large buyers, the CDR sector will not leave the launch pad, and without large government interventions CDR will fail to reach escape velocity.
In this 2023 Year in Review, we'll dive deep into CDR.fyi data to examine what trending on track actually would mean, and explore some key blockers that threaten to knock us off course.
Note: CDR.fyi is the leading data platform for high-permanence CDR. We define durable CDR as having a permanence of over 100 years. Unless noted otherwise, all references to CDR in this report relate to durable CDR.
Highlights & Insights
- The durable CDR market continues to see explosive growth. CDR purchases grew 7.3x to 4.5 megatonnes (Mt), up from 0.615Mt tonnes in 2022.
- CDR Deliveries are scaling, but at a slower pace than purchases. Deliveries grew 2x from 2022-2023, up to 125kt.
- There are now 115 suppliers of CDR with at least 1 sale, and 50 suppliers with at least 1 delivery, up from 74 and 37 respectively in 2022.
- 2023 Purchases were concentrated in BECCS (method) & Ørsted (supplier), driven by a single agreement with Microsoft for 2.67 Mt.
- 2023 Deliveries were concentrated in Biochar, representing 94% of 2023 CDR deliveries.
- The CDR.fyi Price Index for CDR increased to $444 per tonne, with varying price action across methods.
- 32 durable carbon removal companies attracted $577M in equity, despite an overall downturn in climate tech investments. These investments were mainly directed towards North American and European startups.
Key Market Trends
Purchases
Overall CDR purchases grew 7.3x to 4.5 megatonnes (Mt), up from 0.615Mt tonnes in 2022. From 2020 to 2023, this represents a Compound Annual Growth Rate (CAGR) of ~500%.
The three biggest purchases announced this year were:
- Ørsted-Microsoft: In May, Microsoft agreed to purchase 2.67 million tonnes of durable carbon removal from Ørsted over 11 years. The bio-energy capture & storage(BECCS) will be from the Asnæs Power Station and is the largest durable CDR deal to date.
- Heirloom-Microsoft: In September, Microsoft & Heirloom announced an agreement for 315,000 tonnes of CDR using direct air capture (DAC).
- 1PointFive-Amazon: In September, Amazon announced its first DAC purchase, a commitment to purchase 250,000 tonnes CO2 from 1PointFive over the next 10 years.
Another category of deals we track is Letters of Intent (LOI) or Memorandums of Understanding (MOU). These large deals are frequently announced publicly prior to being finalized. There was an additional 0.500Mt of these LOI/MOU agreements announced in 2023, including the JPMC-CO280, Capture6-Respira, and Drax-C-Zero deals. This is a decrease of 75% in LOI/MOU agreements from 2022, driven by the Drax-Respira 2Mt deal in September 2022.
Deliveries
Deliveries continued to scale in 2023, albeit at a slower pace than purchases. Annual Delivery Capacity increased from 25.6 kilotonnes in 2021, to 61.4kt in 2022, to 125.1kt in 2023, representing a Compound Annual Growth Rate (CAGR) of 140%.
Supply Capacity & Order Fulfillment
In 2023, 115 CDR suppliers made at least one sale, up from 74 in 2022. 50 suppliers made at least one delivery, up from 37 the year prior.
Time-to-order fulfillment measures the time between the purchase and the estimated delivery. The median delivery time is now 35 months from when a purchase is made, slightly down from the 2022 Median Time of 36 months.
Note: Order fulfillment data is included on ~10% orders, see Data & Methodology discussion below on the limits & considerations of fulfillment data.
Long order fulfillment times are an indicator that demand outstrips supply in durable CDR. Order books “stack up” with orders further out in the future. Purchasers, with no nearer-term alternative, are forced to wait in line.
But the median doesn’t tell us the whole story. Looking at the “shape” of order fulfillment curves below, we see a trend of “more orders, further out” relative to 2022. Some purchasers are already pre-purchasing deliveries for 2035!
This behavior of buying (and selling) for the future can be seen in time to order fulfillment for the 36+ month range increasing to over 52% of all orders with a known delivery date. This means that over half of CDR orders placed today will be delivered in 2027 or later.
CDR Portfolios
Method
Let’s look at the distribution of 2023 purchases by CDR method, expressed as a percentage of the total purchase volume for the year.
- BECCS: Driven by the Microsoft-Ørsted purchase, the most significant share of CDR purchases was for Bioenergy with Carbon Capture and Storage (BECCS), dominating with 64% of the total.
- DAC: Direct Air Capture (DAC) represented the second-largest method at 19%.
- All Other: Other methods comprised smaller fractions of total purchases: Biochar was responsible for 6%, Bio-oil and Enhanced Weathering were at 3%, and Electrochemical ocean CO2 capture held the smallest share at 1%. The other 2% of the total purchase volume is made up of Biomass Removal (0.66%), Microalgae (0.04%), and Ocean Alkalinity Enhancement (0.02%).
Suppliers
Next, let’s look at the CDR sales by supplier.
Ørsted stands out as the market leader, commanding a majority with 64% of all CDR sales. Heirloom & 1PointFive follow as significant contributors with 8% and 7%, respectively.
Lithos (4%), Charm Industrial (3%), and Climeworks (2%) hold a single-digit percentage of sales. The 109 suppliers in the 'Other' category account for 14% of the market, which suggests a diverse set of smaller suppliers contributing to the rest of the CDR sales.
Deliveries
Deliveries tell a very different story from sales: they continue to be heavily concentrated in biochar, with 92.9% of all durable CDR deliveries. Biomass Removal (4.1%), Mineralization (1.3%), Bio-oil (1.3%), Enhanced Weathering (0.2%), and DAC (0.1%) represent the remainder of deliveries.
When we look at 2023 deliveries by supplier, the portfolio is dominated by biochar suppliers. All of the suppliers shown below are biochar producers:
The top 3 in deliveries in 2023 were:
- Pacific Biochar (21%)
- Wakefield Biochar (18%)
- Aperam BioEnergia (17%)
The remaining 21% in Other represent deliveries by 41 different suppliers.
Purchaser Behavior
This past year, we saw an increase in the total number of purchasers, from 112 to 188. 41 purchasers purchased over 1000 tonnes, and 14 purchased over 10,000 tonnes. The number of large purchasers (> 10kt) grew nearly 2x from 2022.
Who are these CDR purchasers? Breaking down purchasers by Industry Sector, we see the highest concentration of buyers in Financial Services (27%), followed by Software & Services (21%). Professional Services (7%), and Hospitality & Tourism (5%), Buyers Club and Marketplaces (4%), & Media (4%).
The total number of tracked purchases on CDR.fyi grew 47%, from 862 in 2022 to 1,274 in 2023. This is due in part to the natural growth of the market, and in part due to increasing transparency & coverage of CDR.fyi data. We launched the CDR.fyi Portal in December, and have already seen over 150+ partners & over 800 orders disclosed. (To join the CDR.fyi Partner Program, sign up here)
The average purchased tonnage grew significantly to 3,634 tonnes per purchase, up from 726 in 2022. This is driven by an increase in large purchases, as the median purchased tonnage remained relatively unchanged.
As we highlighted in our 2024+ Market Outlook Summary Report, clearer standards and lower prices are key for growth: 58% of purchasers chose lower prices, along with the establishment of clearer standards, as the major contributors to buying more in the future. New tools like the CDR Purchase Calculator, new approaches to Monitoring & Verification, and clear pricing forecasts are all key to helping scale demand.
Pricing
The CDR.fyi Price Index — an all-time weighted average of price per tonne sold — increased from $303 in 2022 to $488 in 2023.
Note: Pricing analysis is based on available data, of which represents ~15% of orders.
Volatility in the CDR.fyi Price Index is largely driven by a mix shift effect: because purchases across years vary by method, they also vary in the weighted average price. The increase in price between 2022 & 2023 indicates a shift from lower-priced methods into higher-priced methods.
Let’s break the aggregate down into the weighted average price per method, compared across years:
We see prices decreasing within DAC (-43%) & Biochar (-38%), with Enhanced Weathering (-16%) & Biooil (-16%) decreasing, but less dramatically. The weighted average price of Biomass Removal (+21%) and Direct Ocean Removal (+42%) increased. Price changes can be driven by a variety of factors, from technologies coming down the cost curve, higher volume purchases, or increased competition for a particular method (i.e. demand vs supply).
Finally, let’s break out the Price Index into the ranges of prices we’ve seen by methods in 2023. Below you can see the average price by method, as well as the range of prices within a given method. We see that some methods still have wide pricing bands, which we believe will converge as the technology within methods matures.
From the CDR.fyi 2024+ Market Outlook Summary Report, the primary intent in purchasing durable CDR now is to support the early development of the CDR field. And Purchasers are willing to pay to invest in the development of the market: in 2024, 79% of purchasers are budgeting over $100 per tonne for durable CDR. Although purchasers expect prices to decline as efficiency, productivity, and volumes increase, 67% still expect to pay $101 to $500 per tonne in 2050.
Leaderboards
The following leaderboards represent the all-time position of suppliers, purchasers & CDR Services at the end of 2023, and their aggregate contributions to the durable CDR market.
Note: Leaders can claim their 2023 Top 10 CDR Leader badge by reaching out to team@cdr.fyi
Suppliers
Suppliers: Deliveries
Suppliers: Sales
Purchasers
Support Services
Registries
Investment in CDR
This year, CDR.fyi published the 2023 CDR Investment Landscape, which provided a detailed perspective on the key investment trends for the year.
In 2023, 32 durable carbon removal companies attracted $577M despite an overall downturn in climate tech investments. This number is based on public sources, the total amount including undisclosed financing is certainly higher.
These investments were mainly directed towards North American and European startups. Financing was spread to other methods with the potential to play a role in driving large-scale durable carbon removal. DAC companies led the way with 25%, followed by carbon in cement/concrete companies (19%), bio-oil (17%), biochar (13%), macroalgae (9%), direct ocean removal (7%), enhanced rock weathering (3.5%), ocean alkalinity enhancement (3.5%), and BiCRS (2.3%).
In addition to the $577M invested in early stage durable carbon removal companies, two late-stage companies, namely Carbon Engineering and 1PointFive, also received significant investments in 2023. Carbon Engineering was acquired by Occidental Petroleum for $1.2B while 1PointFive (also a subsidiary of Oxy) received a $550M investment from BlackRock for the development of its STRATOS project.
Special Analysis - What would it mean to be on track?
We have seen a consistent growth of the CDR market, with the volume of purchases growing at least 5x three years in a row. A 4-500% annual growth is not unusual for a nascent sector but is not likely to continue for many years. How fast would durable CDR need to grow for us to meet midcentury needs?
This question is more complex than often recognized. The often quoted IPCC models include 6-10 gigatonnes (Gt) of CDR in the second half of this century. But this number is a mix of what is needed to reach net zero and halt warming, and what would be needed to bring temperatures back down to 1.5C after we have achieved net zero. It also mixes durable CDR and carbon stored in forests. Only durable CDR can neutralize ongoing fossil emissions to halt warming, reaching net zero CO₂. To offset other greenhouse gases, land-use change, and historic emissions, more short-lived removals could be used. It is theoretically possible to reduce CO₂ emissions to zero in all sectors; practically speaking, however, durable carbon removal is likely to be the most cost-effective and feasible option for reaching net zero for certain hard-to-abate sectors, such as aviation.
Thus, the scale needed for durable CDR at net zero by midcentury hinges on determining where it is the optimal choice, which remains uncertain with the limited analyses completed to date. Our CDR Calculator, aligning with SBTi pathways, models about 4 Gt of durable CDR by 2050, equating to approximately 10% of total annual CO₂ emissions today.
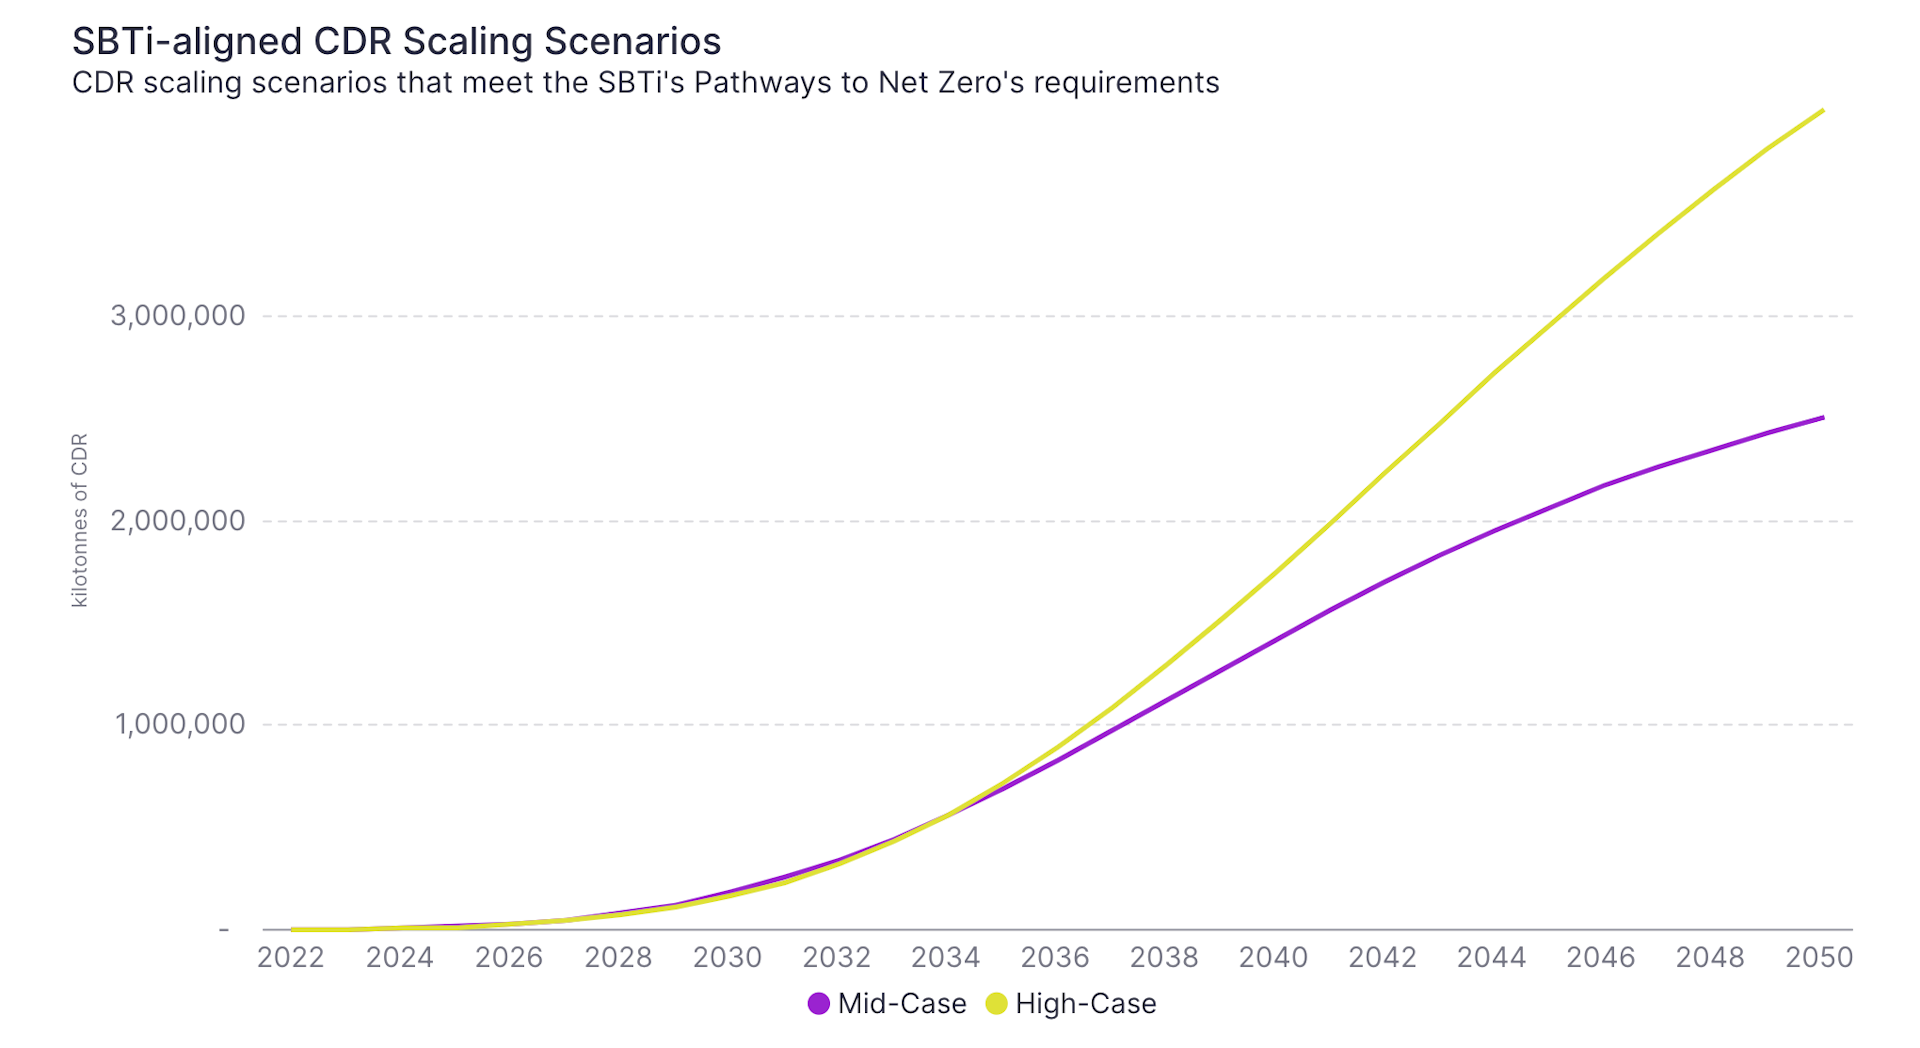
Are we on track to reach 4 Gt per year of durable CDR by 2050? Recent research led by Greg Nemet highlighted that we are in a formative phase for durable CDR where deployments in the next 10-15 years will determine if durable CDR will be available in the quantities needed. Studying the scale-up of other technologies, the Nemet study suggests that at least around 3 Gt of CO2 need to be cumulatively removed between 2020 to 2040 for annual CDR capacity to be able to reach 4-5 Gt removals annually in the 2050s. 3 Gt in cumulative removals by 2040 could be reached with many different growth trajectories. What we feel confident saying is that if novel CDR has not reached tens of millions of tonnes removed per year by 2030 we will be far behind. Current growth rates in purchases and deliveries puts us well on track for reaching this - if we maintain them. Of course, the growth would grind to a halt without the number of big buyers increasing every year. Currently, there are only 6 buyers that purchased over 100,000 tonnes and 14 others that bought at least 10,000 tonnes. If we have a few hundred additional such buyers entering the market in the coming years we would feel a lot more confident about our collective ability to stay on track to meet durable CDR targets.
So, are there more big buyers on their way in, and what else does 2024 hold in store? Stay tuned to CDR.fyi to watch what will surely be another exciting year!
2023 Year in Review was written by Robert Höglund, Kevin Niparko, Quentin Servais-Laval, Tank Chen, Alex Rink, Alina Baron, Michael Guzzardi, Michelle Bajurny, Roden Sherpa. Sector analysis by Nadine Walsh.
Appendix & Data Considerations
CDR.fyi tracks 100+ year permanence carbon removal purchases & deliveries. Data are drawn from public and private disclosures. See Methodology, Considerations & Limitations for additional details on the approach.
For any corrections or questions, contact team@cdr.fyi. For data licensing & partnership inquiries, contact partnerships@cdr.fyi